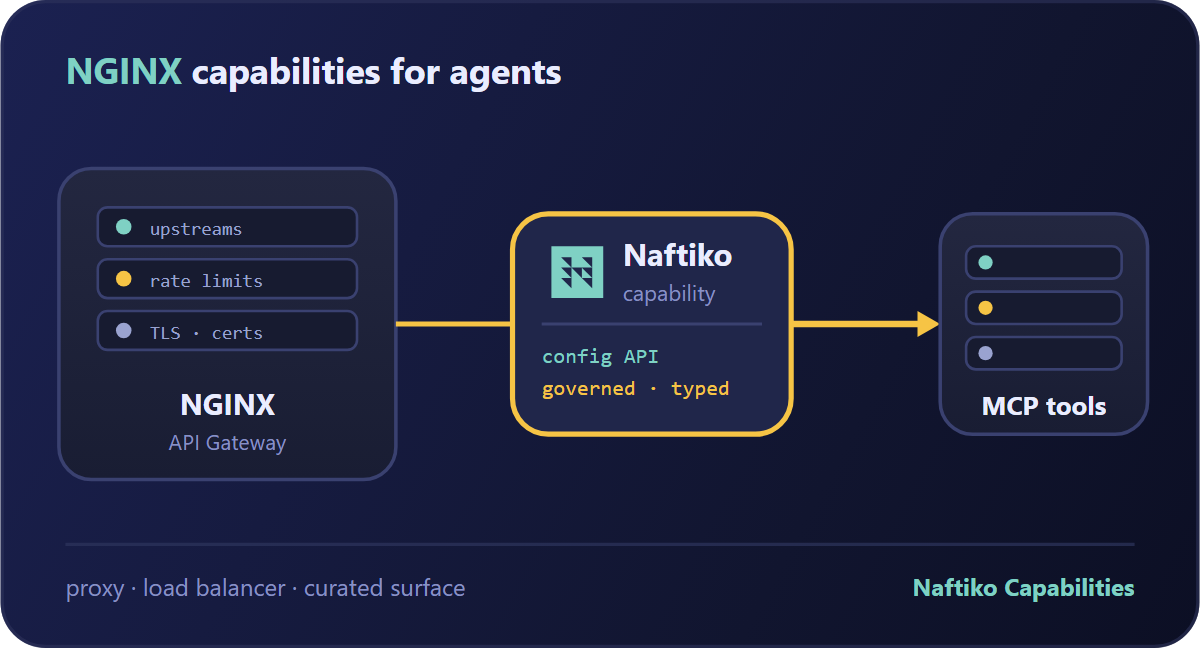
NGINX is the most widely deployed web server and reverse proxy in the world, and via the NGINX Plus API it exposes a rich management surface for traffic monitoring, upstream management, and dynamic configuration. The Naftiko capability set for NGINX covers two complementary surfaces: monitoring and observability for real-time traffic insight, and traffic management for dynamic upstream control.
What the Capability Covers
Two workflow capabilities: Monitoring and Observability (real-time metrics across connections, requests, server zones, caches, upstreams, and stream services) and Traffic Management (dynamic upstream server control without reloading configuration).
MCP Tools Available
Monitoring: get-stub-status, get-nginx-info, get-connections, get-http-requests, get-http-server-zones, get-http-location-zones, get-http-caches, get-http-limit-conn-zones, get-http-limit-req-zones, get-http-upstreams, get-stream-server-zones, get-stream-upstreams
Traffic Management: get-http-upstream-servers, add-http-upstream-server, modify-http-upstream-server, remove-http-upstream-server, get-http-keyval-zone, add-http-keyval, modify-http-keyval
Capability Specification
naftiko: "1.0.0-alpha1"

info:
  label: "NGINX Monitoring And Observability"
  description: >-
    Workflow capability for monitoring NGINX instances combining Plus HTTP API
    detailed statistics with Stub Status basic metrics. Provides comprehensive
    observability across connections, HTTP requests, server zones, location
    zones, caches, rate limiting, and upstream health.
  tags:
    - NGINX
    - Monitoring
    - Observability
    - Metrics
    - Health Checks

capability:
  consumes:
    - namespace: nginx-plus-api
      type: http
      baseUri: http://localhost:8080/api
      authentication:
        type: basic
        username: "{{NGINX_USERNAME}}"
        password: "{{NGINX_PASSWORD}}"
      resources:
        - name: nginx
          path: "/8/nginx"
          operations:
            - name: get-nginx-info
              method: GET
        - name: connections
          path: "/8/connections"
          operations:
            - name: get-connections
              method: GET
        - name: http-upstreams
          path: "/8/http/upstreams"
          operations:
            - name: get-http-upstreams
              method: GET
        - name: http-server-zones
          path: "/8/http/server_zones"
          operations:
            - name: get-http-server-zones
              method: GET
    - namespace: nginx-stub-status
      type: http
      baseUri: http://localhost:8081
      authentication:
        type: basic
        username: "{{NGINX_USERNAME}}"
        password: "{{NGINX_PASSWORD}}"
      resources:
        - name: stub-status
          path: "/stub_status"
          operations:
            - name: get-stub-status
              method: GET

  exposes:
    - type: mcp
      port: 9201
      namespace: nginx-monitoring-mcp
      description: "MCP tools for NGINX monitoring and observability."
      tools:
        - name: get-stub-status
          description: "Get basic NGINX status metrics from stub_status module."
          hints:
            readOnly: true
          call: "nginx-stub-status.get-stub-status"
          outputParameters:
            - type: string
              mapping: "$."

        - name: get-nginx-info
          description: "Get NGINX Plus instance status and version information."
          hints:
            readOnly: true
          call: "nginx-plus-api.get-nginx-info"
          outputParameters:
            - type: object
              mapping: "$."

        - name: get-connections
          description: "Get current client connection statistics."
          hints:
            readOnly: true
          call: "nginx-plus-api.get-connections"
          outputParameters:
            - type: object
              mapping: "$."

        - name: get-http-upstreams
          description: "Get health and statistics for all HTTP upstream groups."
          hints:
            readOnly: true
          call: "nginx-plus-api.get-http-upstreams"
          outputParameters:
            - type: object
              mapping: "$."

        - name: get-http-server-zones
          description: "Get traffic statistics per HTTP server zone."
          hints:
            readOnly: true
          call: "nginx-plus-api.get-http-server-zones"
          outputParameters:
            - type: object
              mapping: "$."
Running It
docker pull ghcr.io/naftiko/framework:latest

# Set NGINX_BASE_URL in your .env file
docker run -p 9201:9201 \
  -v ./capabilities/monitoring-and-observability.yaml:/app/capability.yaml \
  --env-file .env \
  ghcr.io/naftiko/framework:latest /app/capability.yaml
The NGINX monitoring tools are especially valuable for AI-assisted capacity planning: an agent can poll get-http-upstreams, identify overloaded upstreams, and call add-http-upstream-server from the traffic management capability to dynamically scale capacity — without any NGINX reload required. The NGINX capability set is part of the Naftiko Fleet.